hidecan is an R package for generating HIDECAN plots, which are visualisations summarising the results of one or more QTL mapping, genome-wide association study (GWAS) and transcriptomics differential expression (DE) analysis, alongside candidate genes of interest.
Installation
hidecan is available on the CRAN and can be installed via:
install.packages("hidecan")Alternatively, you can install the development version of hidecan from GitHub with:
# install.packages("devtools")
devtools::install_github("PlantandFoodResearch/hidecan")
Usage
The hidecan package works as follows:
it takes as an input one of more data-frames containing QTL mapping results, GWAS results, differential expression results and list of candidate genes of interest;
it computes the length of each chromosome based on the genomic position of the regions, markers and genes provided in the input data;
it filters the datasets to retain significant regions/markers or differentially expressed genes, according to a threshold on their score and/or log2-fold change. The fold-change is set by the user, and can be different for QTL mapping, GWAS and differential expression results.
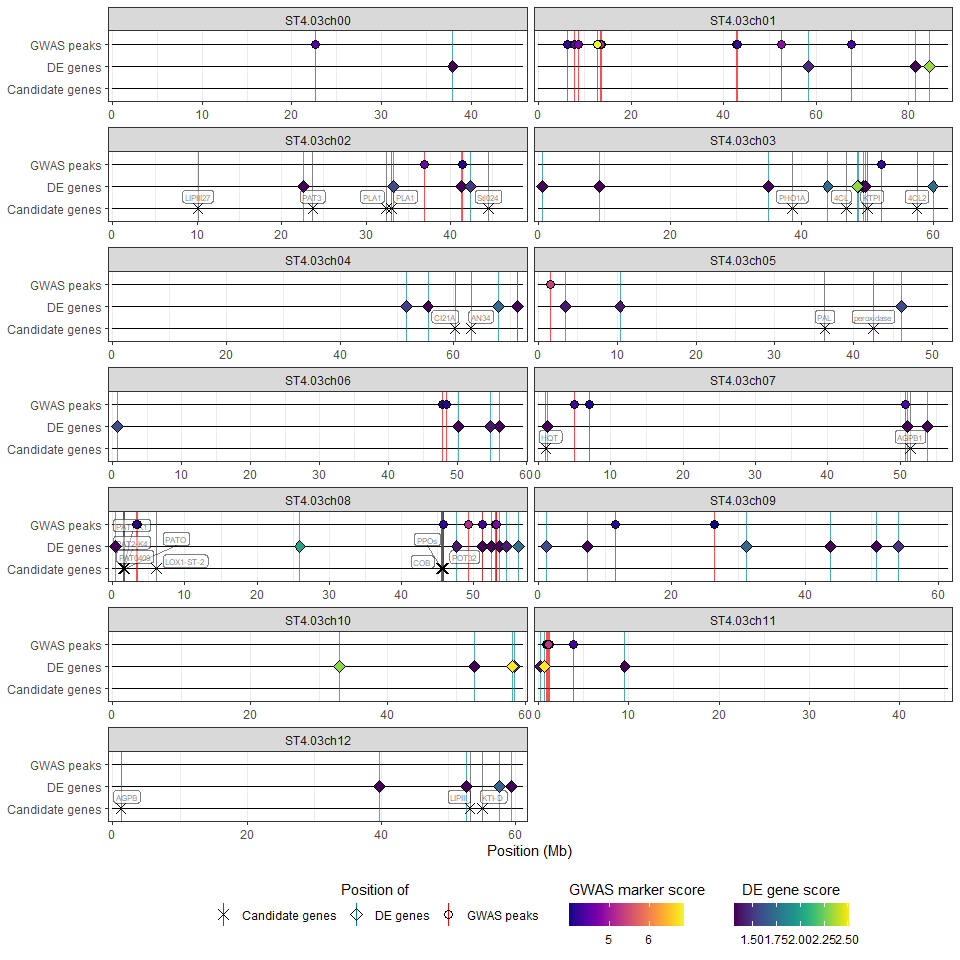
it displays the position of the significant regions, markers and genes alongside candidate genes (HIDECAN plot). The plot can be customised by the user via a number of parameters (e.g. legend position or label size).
The wrapper function hidecan_plot() performs all of these steps. Its use is demonstrated below with an example dataset:
library(hidecan)

## Getting an example dataset
x <- get_example_data()

hidecan_plot(
  qtl_list = x[["QTL"]],            ## data-frame of QTL mapping results
  gwas_list = x[["GWAS"]],          ## data-frame of GWAS results
  de_list = x[["DE"]],              ## data-frame of DE results
  can_list = x[["CAN"]],            ## data-frame of candidate genes
  score_thr_qtl = -log10(0.0001),   ## sign. threshold for QTL mapping
  score_thr_gwas = -log10(0.0001),  ## sign. threshold for GWAS
  score_thr_de = -log10(0.05),      ## sign. threshold for DE
  log2fc_thr = 0,                   ## log2FC threshold for DE
  label_size = 2                    ## label size for candidate genes
)
Citation
If using HIDECAN, please cite:
Angelin-Bonnet, O., Vignes, M., Biggs, P. J., Baldwin, S., & Thomson, S. (2024). Visual Integration of Genome-Wide Association Studies and Differential Expression Results with the Hidecan R Package. Genes, 15(10), 1244. https://doi.org/10.3390/genes15101244